A Risk Profile is your willingness and ability to take risks with your investments. Generally, the higher the return on an investment, the greater the risk. Often this risk relates to the level of volatility or price movement. Find out how this Risk may be measured.
For example, a portfolio of good quality shares will most likely give you a higher return than a cash management account. However, there may be times when the share prices falls, but the value of the cash remains the same.
The changes in price can sometimes be quite significant and take time to recover. You may recall this happening during the GFC of 2008.
Risk Profiling is about your acceptance that the higher return, comes with the risk that the anticipated high returns may not be achieved, and you may lose money. How much money you are prepared to lose during these price fluctuations will help determine your Risk Profile.
Finametrica’s Risk Profile will evaluate your attitude to risk and return. From the details given in your report, an investment portfolio can be designed which is likely to fit your personal risk tolerance.
Everyone has a personal attitude to how much risk they feel comfortable with when investing. There is no right or wrong answer. Just as some people like spiders, most like to keep a healthy distance and others are terrified, so do attitudes to risk and return differ. Finametrica’s Risk Profile test will allow you to establish your risk profile and help you or your adviser choose an asset allocation which is likely to suit your risk tolerance.
With more than 30% of the population under financial stress to the point where their health, relationships and productivity at work are affected, knowing your risk profile may help you reduce your financial stress.
I often say to people that you should not invest in anything you don’t understand or anything which is likely to give you sleepless nights worrying about how much money you might lose.
Paul Resnick, the designer of Finametrica’s Risk Profile, has spent a lifetime developing and perfecting a test that establishes your level of risk tolerance. Paul is an Australian, who is recognized as a world expert with Finametrica used extensively in many countries.
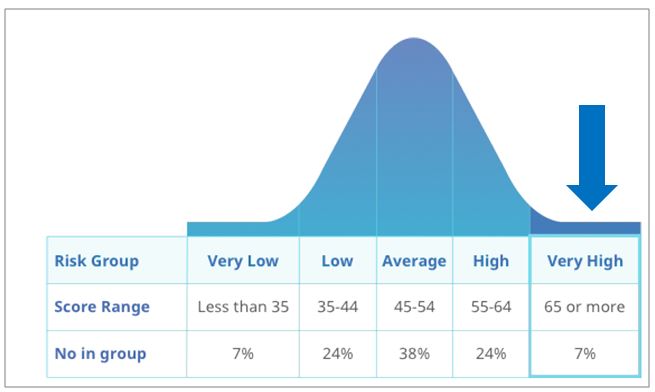
I believe that everyone should at least once, undergo a Risk Profile Test. Finametrica is the benchmark best practice assessment. For as little as $55 you can undergo the test online and receive a report which will explain where you fit within the general population. This graph is from a report where the person is shown to be in the ‘Very High’ range of the test.
The report suggests a suitable Mix of Investments which are likely to match your Risk Profile results. In this case, it is Portfolio 6.
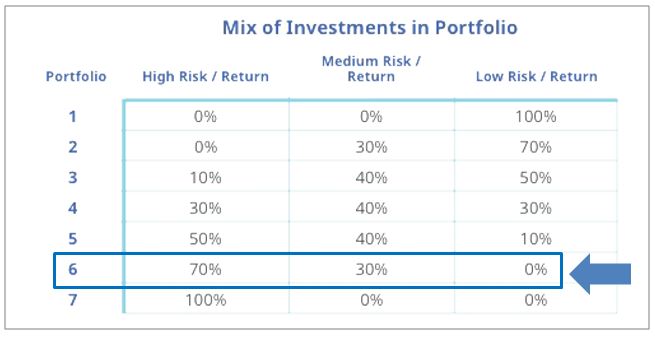
For each question answered, your response will be explained and help you understand what level of risk matches your investment personality. This information can be used to develop a suitable Asset Allocation of your investment portfolio.
Alternatively, your Financial Adviser, will most likely give you this or a similar risk profile assessment and explain how your investment portfolio has been structured to meet your specific requirements to fit both your risk tolerance and meet your financial goals. Sometimes the two will not match and you should discuss how best to resolve this problem.
Investments are divided into Defensive and Growth Assets. Defensive Assets are usually interest earning assets which have no or little potential for change in price and there is little risk you will lose money. Fixed Interest securities may change in value with a change in interest rates. Only those who choose to sell prior to the maturity date will be affected by the price change. If Interest rates have risen, the value of the security will fall, but if interest fall, the value of the security will rise. Defensive assets are usually guaranteed by a government, bank or large corporation.
While there is less risk of losing your capital invested, there is another risk. That is the risk that time and inflation will devalue the purchasing power of your money. Thus the $100,000 you invested 5-years ago, will have a real value of only $88,385 with an Inflation Rate of 2.5%. This coupled with tax on the interest earned and low returns of say 2% – 4%, your money will be lucky to hold its current value.
This is a risk many people don’t realize when they choose to keep most of their money in Defensive Assets.
Growth Assets, over the long term are expected to generate a higher return but with more risk. These assets are usually related to shares or property. They are expected to grow in value as well as generate a higher effective interest rate. There are often tax incentives such as imputation credits for equities, building write-offs and depreciation for property and negative gearing for both. Shares are generally considered more risky than property. This is due to the increased short-term volatility shares may experience. If you invest in property through a property trust, you may experience similar volatility to shares. Property cycles tend to be shorter and less volatile than that of shares.
When investing in Growth Assets, you need to match your investment time horizon. The longer the time frame, the more likely you are to be successful over the longer term. It is generally accepted best practice that one should spread your risk by diversifying your investments. The expectation is that different assets are likely to rise and fall at different times, thus the additional profits in one asset will cancel out any potential loss in another asset. The important thing is that no one can predict which assets are going to rise and fall within a time frame. Often it is cheaper to ride out the ups and downs of asset prices in the hope that over the long term Growth Assets will out-perform Defensive Assets.
Matching your Risk Profile to your Investments can be a set of trade-offs. The primary one will be how much risk you are prepared to take and how much risk is needed to achieve your financial goals. Thus, the gap between these two will require you to decide if you should:
- Save more money to accommodate the lower returns from a risk adverse portfolio
- Lower your financial expectations and find ways to live with less money
Finametrica Risk Profile
The Risk Profile test can be either a 10 or 25 set of multiple choice questions. These have been carefully designed to evaluate your attitudes, values and experiences. Most people will fall in the average or close to either side of average.
I have undertaken both these tests and found them to be extremely easy to follow. The report generated from the results will give you a very clear explanation of the results. It may help you resolve any risk issues you need to address.
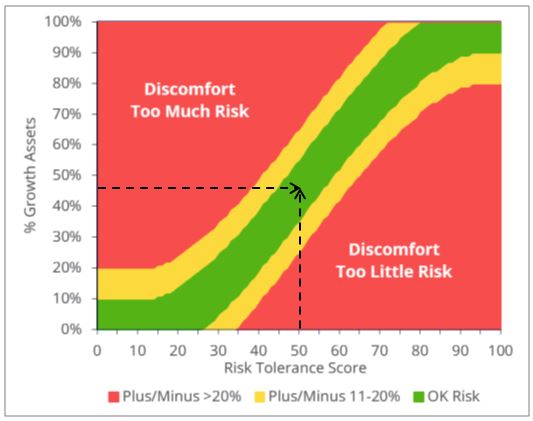
Finametrica’s score reflects a person’s risk tolerance in terms of the percentage of Growth Assets held. For example, a risk tolerance score of 50 translates to 45% Growth Assets and 55% Defensive. However, this is not finite and a range of say 43% to 47% would be quite acceptable.
This is a graph showing the bands of risk acceptable to the investor with a Risk Profile of 50. The green ribbon is an acceptable range of percentage of Growth Assets for different Risk Tolerance Scores. The red areas arears display discomfort from either ‘too much risk’ or ‘too little risk’.
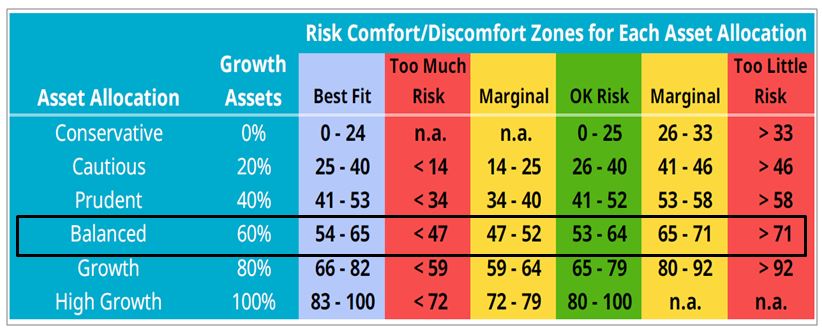
Risk Profile tests may also use broad bands which describe the investor attitude to risk. Different systems will use different terms. In the case of Finametrica, they refer to these categories as Risk Comfort / Discomfort Zones and are divided into 6-categories, based on the percentage of Growth Assets.
Changing Risk Profile
One’s tolerance to risk is likely to change over time. Generally one can afford to hold more Growth Assets in the early stages of asset accumulation because they have time to recover from an adverse event like a fall in the share prices. As you get older, recovery from adverse events is likely to be more difficult and thus one will probably reduce the percentage of Growth Assets.
In Financial Mappers, the program tracks the Percentage of Growth Assets over the life of a plan. This is a 50-year plan starting from age 40, and extending to age 90. Note how the level of Growth Assets have decreased over time. The asset allocation has been rebalanced by increasing the value of Defensive Assets.

In addition, Financial Mappers tracks the Asset Allocation. The Defensive Assets are displayed in shades of blue.

Financial Mappers also has a system that categorizes the assets in to 6-broad bands which are referred to as the Investment Profile of the investments. The allocation is according to the Percentage of Growth Assets in a similar manner to that of Finametrica, but the descriptions are different.
Over the length of the plan the investor has moved from Aggressive (in year 3), to High Growth, Balanced and then Conservative for the last 11-years.

It is in the area of Risk Profiling and Asset Allocation that a Financial Adviser can add real value.
MoneySmart
For some very simple explanations regarding Risk, the MoneySmart Website has some excellent information. The site gives information on risk:
- How do you feel about risking your money?
- How much investment risk should you accept?
- What we mean by Growth, Balanced and Conservative
MoneySmart also discusses Risk and Return:
- Is it worth the gamble?
- Understand investment risk
- Tactics to manage investment risk
- Watch out for investment scams
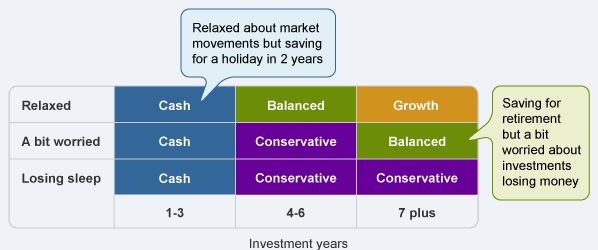
MoneySmart matches the type of investments to whether you are relaxed, a bit worried or losing sleep over your investments. It recommends different portfolio types for different time periods.
Warren Buffett’s view on Risk Profile
Warren Buffett, the world’s most successful investor and famous for his iconic quotes gives us yet another classic.
Risk comes from not knowing what you are doing.
From my experience of talking to people with limited financial knowledge, they fall into two types.
The first are those that are overly cautious and miss out on many opportunities. This means that to achieve their financial goals, they often have to save much more than those who take some chances with the inclusion of Growth Assets.
The second group are overly optimistic and are always looking for the ‘Get Rich Quick’ investment. They often pour all their money in one poor choice. They fail to recognize financial dangers which may be lurking beneath the surface of such investments. Storm Financial is a classic example of how 3,000 investors were left destitute after the investment failed.
How to Protect Your Investments
I believe there are some very simple things you can do to protect yourself from falling into either of these groups.
The first is to improve your level of financial literacy so you understand the implications of poor investment choices. My free Money Smart Tips in 3-Minutes a Day is a good place to start.
Secondly take the time to read some simple personal finance books. By far the best value is to purchase on-line Noel Whittaker’s A Bundle of Wisdom. This is the great value for a collection of four books.
Read my Book Reviews to find something which suits your interests.
Finally seeking advice from a Financial Adviser will help you plan your financial future. This will allow you to build a long term relationship with an adviser, who over time will guide you through the hazards of investing. The problem for most people just starting out is they don’t have sufficient investments to warrant the cost of a full service financial advice. Hopefully, over time, Financial Advisers will find a cost-effective way to meet your current needs.
In the meantime, understand what investments are likely to suit your Risk Profile by taking the test. Then start saving on a regular basis. You will be quite surprised how you can build up that ‘little nest egg’ before you seek that professional advice.
Watch Video
To learn more about Risk Profiling and Asset Allocation using Financial Mappers, view this video.
Glenis Phillips SF FIN – Designer of Financial Mappers
Disclaimer: Financial Mappers does not have an Australian Services License, does not offer financial planning advice, and does not recommend financial products.


