
Most people steer away from the topic of Statistics. In this article I want to give you a set of four statistics that can act as a guideline to making sound financial decisions. These statistics are:
Understanding the importance of financial statistics is crucial in today’s economic landscape. These metrics not only guide individuals in making informed choices but also enable them to track their financial health over time. By analyzing statistics related to savings, debts, investments, and asset allocation, one can uncover insights that are pivotal for long-term financial stability.
- Savings Rate
- Debt Servicing Ratio
- Return on Investment
- Asset Allocation
Savings Rate
The Savings Rate is the value of savings divided by after-tax income expressed as a percentage.
For example, if you save $100 a week and your after-tax income is $1,000), your Savings Rate is 10%.
The 50%, 30%, 20% rule is a well-known budgeting strategy that can help individuals manage their finances effectively. This rule recommends that 50% of your after-tax income should go towards needs, which encompasses fixed costs like housing and utilities. The remaining 30% is for wants, allowing for discretionary spending such as dining out and entertainment, while the last 20% is dedicated to savings, creating a robust safety net.
I always remind Australians that as of July 2025 your employer saves 12% of your income as the Superannuation Guarantee Levy SGL. If you include your superannuation contributions as part of your savings, then you would need to allocate only 8% of after-tax income to savings.
It’s also vital to regularly review your Savings Rate. Conducting a monthly budget review to assess your expenses and adjusting your savings goals in response to financial changes or unexpected costs can optimize your savings strategy. For instance, if you start a new job and your income increases, consider increasing your savings contribution to reflect your new financial situation.
Debt Servicing Ratio or Debt to Income Ratio
The Debt Servicing Ratio (DSR) is the percentage of your after-tax income allocated to loan payments. A similar ratio is called the Debt-to-Income Ratio (DTI). The difference is that the Before-Tax (Gross Income) is used instead of the after-tax income.
If you have a Home Loan with monthly loan payments of $3,000 and your after-tax income is $10,000 a month, your DSR is 30%.
In simple terms, this means that of your $10,000 disposable income, $3,000 (30%) is allocated to servicing debt.
Maintaining a Debt Servicing Ratio within the recommended range is essential for financial wellness. If your DSR exceeds 32%, it may be time to evaluate your spending habits and debt obligations. Additionally, implementing strategies such as debt consolidation or refinancing could help lower monthly payments, thus improving your DSR.
It is generally accepted that a Debt Servicing Ratio should not exceed between 30% and 32%.
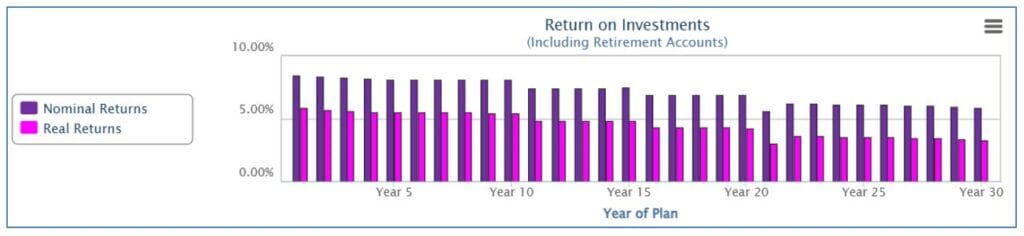
Return on Investment
Return on Investment is calculated as the income on investments divided by the value of the investments.
Calculating your Return on Investment (ROI) is not just about the numbers; it also involves understanding the context of those investments. Consider the industry, market trends, and potential risks associated with your investment choices. Regularly reviewing your ROI will help you make informed decisions about whether to hold, sell, or buy more of an asset.
Sometimes it is prudent to consider the Real Rate of Return which discounts of effect of Inflation. It is generally accepted that a good rate of return is between 4.5% and 5% plus inflation.
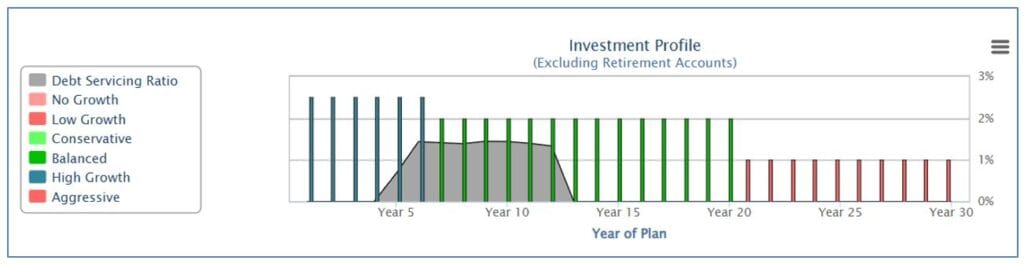
Asset Allocation
Effective Asset Allocation is about balancing risk and reward in your investment portfolio. Regularly reassessing your asset mix based on age, risk tolerance, and market conditions is crucial. For example, younger investors may opt for a higher percentage of growth assets, while those nearing retirement might shift towards conservative investments to protect their capital.
Asset Allocation may be described in two formats. In Financial Mappers, these are described as:
Many financial advisors recommend using a diversified mix of asset classes to mitigate risks. This could include stocks, bonds, real estate, and even alternative investments such as commodities. Understanding how different asset classes react to market changes can help in making informed decisions about your portfolio.
- Investment Profile
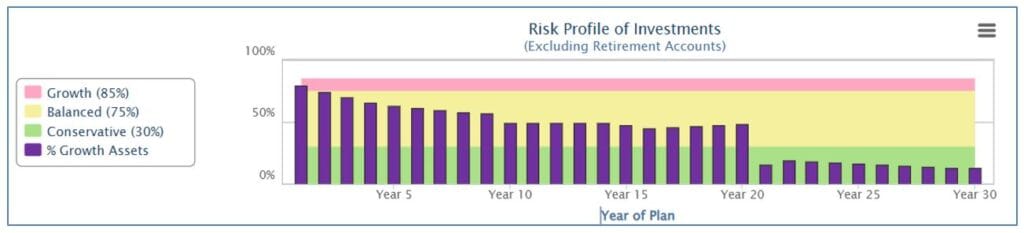
- Risk Profile
Investment Profile allocates the assets according to the percentage of interest earning accounts using 20% allocations. (Note the DSR is displayed in this graph).
Risk Profile calculates the percentage of Growth Assets (property and shares). MoneySmart categories the percentages as:
- Growth (85%+)
- Balanced (31% – 84%)
- Conservative (0% – 30%)
Subscribe to Financial Mappers Blogs
Please register on the Financial Mappers Blog Page to receive notification when new articles are uploaded.
If you have friends or family who you think would love to have this free resource, please share this article.
Sharing financial resources, like this article, can foster a culture of financial literacy within your community. Encourage discussions around financial planning and management among friends and family. Engaging in these conversations can lead to better financial decisions collectively, as individuals share insights and strategies that have worked for them.
To find out more, please watch this short video Understanding Statistics.
Videos and online resources are excellent tools for enhancing your understanding of complex financial topics. Utilize platforms like YouTube to access a myriad of educational content on financial management and investment strategies. By continuously educating yourself, you empower your financial decision-making process.
Building a strong financial future requires informed decisions based on reliable data and statistics. By embracing these principles and consistently applying them, you contribute to your financial well-being and that of your loved ones. Remember, the journey to financial literacy is ongoing, and every step taken brings you closer to achieving your financial goals.
In conclusion, utilizing financial statistics effectively can guide individuals towards achieving financial independence and success. By keeping track of your savings, debt levels, investment returns, and asset allocation, you can navigate the complexities of personal finance with confidence. Stay informed, stay engaged, and remember to prioritize your financial health.
Financial Mappers FREE
With Financial Mappers FREE is now available. Click here to join.
Glenis Phillips SF Fin – Designer of Financial Mappers and Advice Online
Disclaimer: Financial Mappers does not have an Australian Services License, does not offer financial planning advice, and does not recommend financial products.


